|
Time
|
Data and Events
|
Importance
|
|
To be determined
|
Heads of state and government of NATO countries will hold a summit in The Hague from June 24 to 25.
|
★★★
|
|
To be determined
|
The Summer Davos Forum will be held until June 26.
|
★★★
|
|
16:00
|
Germany’s June IFO Business Climate Index
|
★★★
|
|
18:00
|
UK’s June CBI Industrial Orders Balance
|
★★★
|
|
20:30
|
Canada’s May CPI Monthly Rate
|
★★★
|
|
U.S. First Quarter Current Account
|
★★★
|
|
21:00
|
U.S. April FHFA House Price Index Monthly Rate
|
★★★
|
|
U.S. April S&P/CS 20-City Composite Home Price Index Yearly Rate
|
★★★
|
|
21:15
|
2026 FOMC voting member Harker will speak on monetary policy.
|
★★★
|
|
22:00
|
Federal Reserve Chairman Powell will deliver semiannual monetary policy testimony in the House of Representatives.
|
★★★★★
|
|
Bank of England Governor Bailey will attend the House of Lords Economic Affairs Committee meeting.
|
★★★
|
|
U.S. June Conference Board Consumer Confidence Index
|
★★★
|
|
U.S. June Richmond Fed Manufacturing Index
|
★★★
|
|
22:00
|
2026 FOMC voting member Harker will participate in a panel discussion at the Barclays-Center for Economic Policy Research (CEPR) Monetary Policy Forum.
|
★★★
|
|
The next day
00:30
|
FOMC permanent voting member Williams will speak.
|
★★★
|
|
Variety
|
Viewpoint
|
Support Range
|
Resistance Range
|
|
U.S. Dollar Index
|
Weak oscillation
|
96-97
|
100-100.5
|
|
Gold
|
Short-term correction
|
3330-3350
|
3450-3480
|
|
Crude Oil
|
Short-term correction
|
64-65
|
79-80
|
|
Euro
|
Strong oscillation
|
1.1450-1.1480
|
1.1600-1.1630
|
*Pre-market views are time-sensitive and limited, are predictions only, and are for reference and learning purposes only. They do not constitute investment advice, and the risk of operation is borne by the individual. Investment carries risks; trading requires caution.
Fundamental Analysis:
In June, the Federal Reserve maintained interest rates for the fourth consecutive time. The dot plot indicates two rate cuts within the year. Inflation levels are slightly high, uncertainty in the economic outlook has decreased, and the unemployment rate remains low, indicating a stable labor market. In May, non-farm payrolls added 139,000 jobs, which is basically in line with expectations, and the unemployment rate remained unchanged, showing a robust labor market. The unadjusted CPI year-on-year rate in May slightly increased but was below expectations, with a neutral short-term impact.
Technical Analysis:
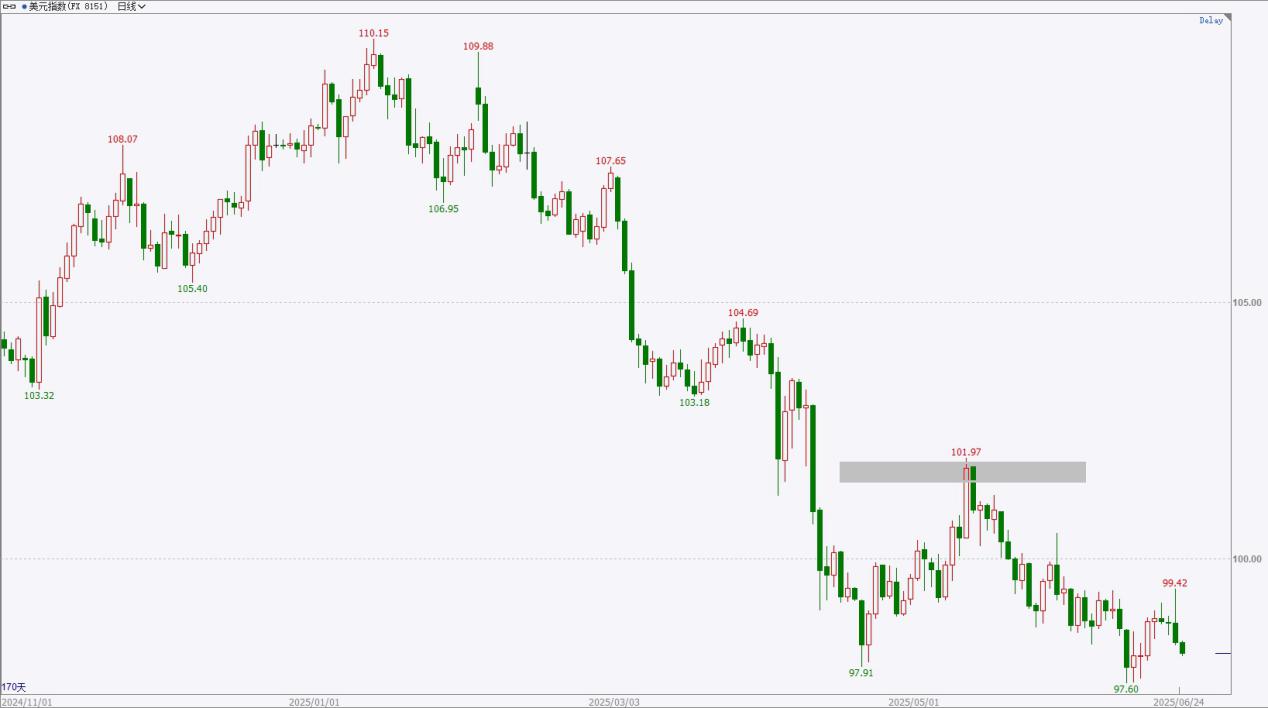
The U.S. Dollar Index rose and then fell yesterday, closing with an upper shadow and a bearish candle body. The price encountered resistance and retreated, with the short-term trend resuming a weak pattern, possibly testing the support below again. Overall, it shows a large-scale weak oscillation structure, with a large bearish candle on the weekly chart, indicating a short-term rebound trend. The upper resistance area is around 100-100.5, while the lower support area is around 96-97.
Viewpoint: Weak oscillation, focus on support near previous lows, and watch if the price will create new lows again.
*Pre-market views are time-sensitive and limited, are predictions only, and are for reference and learning purposes only. They do not constitute investment advice, and the risk of operation is borne by the individual. Investment carries risks; trading requires caution.
Fundamental Analysis:
The geopolitical situation in the Middle East continues to escalate, with conflicts between Israel and Iran, and instability in Eastern Europe. The European Central Bank’s June interest rate decision saw a 25 basis point cut for the seventh consecutive time, nearing the end of the rate-cutting cycle, while lowering inflation expectations for this year and next, as well as GDP growth expectations for next year. The Federal Reserve’s June interest rate decision remained unchanged, with inflation levels slightly high and a robust labor market, while the dot plot indicates two rate cuts within the year. In May, the U.S. non-farm payrolls saw a slight decline in new jobs, with the unemployment rate remaining unchanged; the unadjusted CPI year-on-year in May showed a slight increase. Attention is on changes in the Middle East situation.
Technical Analysis:
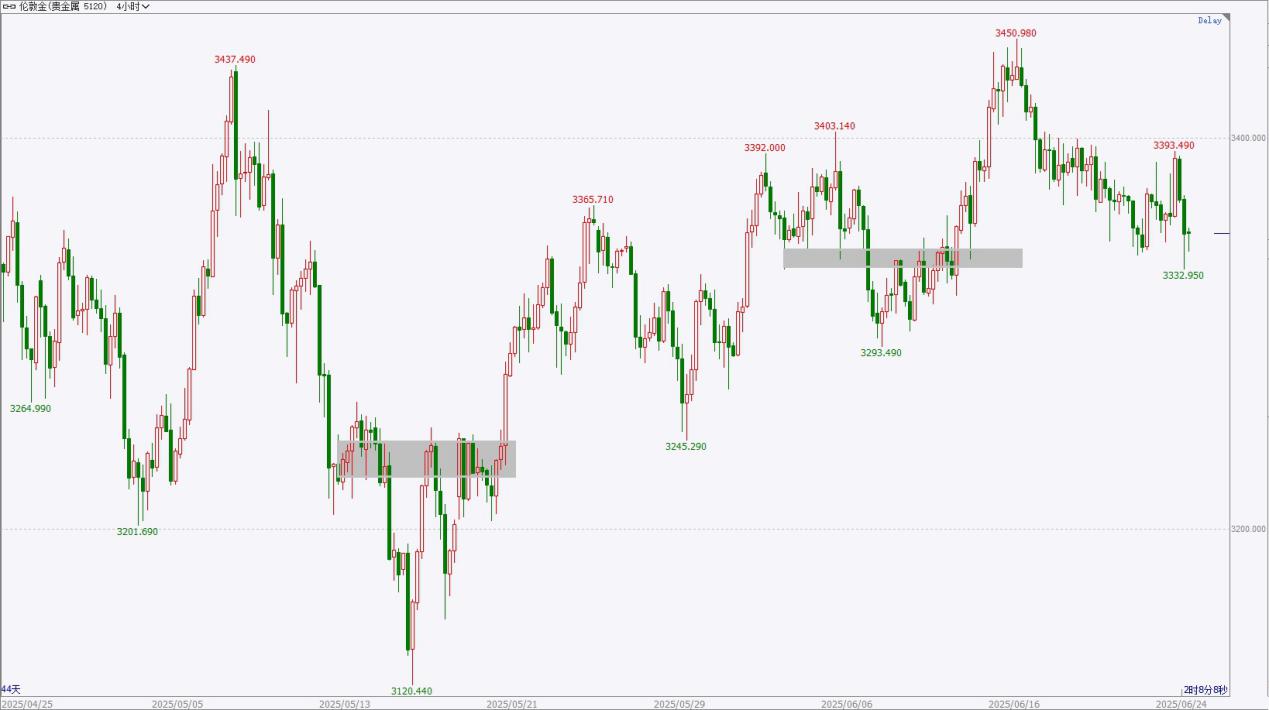
Gold prices saw a slight rise and then a retreat yesterday, with a short-term oscillating structure, currently near a support area. Attention is on signs of stabilization; if it clearly breaks below the support area, the market may weaken further. From a longer-term perspective, the daily chart shows a strong oscillation, encountering resistance near previous highs and retreating. The upper pressure level is around 3450-3480, while the lower support level is around 3330-3350.
Viewpoint: Short-term correction, oscillation in the support area, focus on signs of stabilization.
*Pre-market views are time-sensitive and limited, are predictions only, and are for reference and learning purposes only. They do not constitute investment advice, and the risk of operation is borne by the individual. Investment carries risks; trading requires caution.
Fundamental Analysis:
The June EIA monthly report slightly raised oil price forecasts for this year and next; the OPEC monthly report maintained global oil demand growth expectations for this year and next, as well as economic growth expectations; the IEA monthly report slightly lowered oil demand expectations for this year and next. At the end of May, the OPEC+ ministerial meeting agreed to set 2025 oil production as the benchmark for 2027, with another round of negotiations expected in early June, potentially reaching an agreement to accelerate oil production increases in July. Conflicts in the Middle East may lead to tighter supply expectations. Attention is on changes in the Middle East situation and the EIA crude oil inventory report on Wednesday.
Technical Analysis:
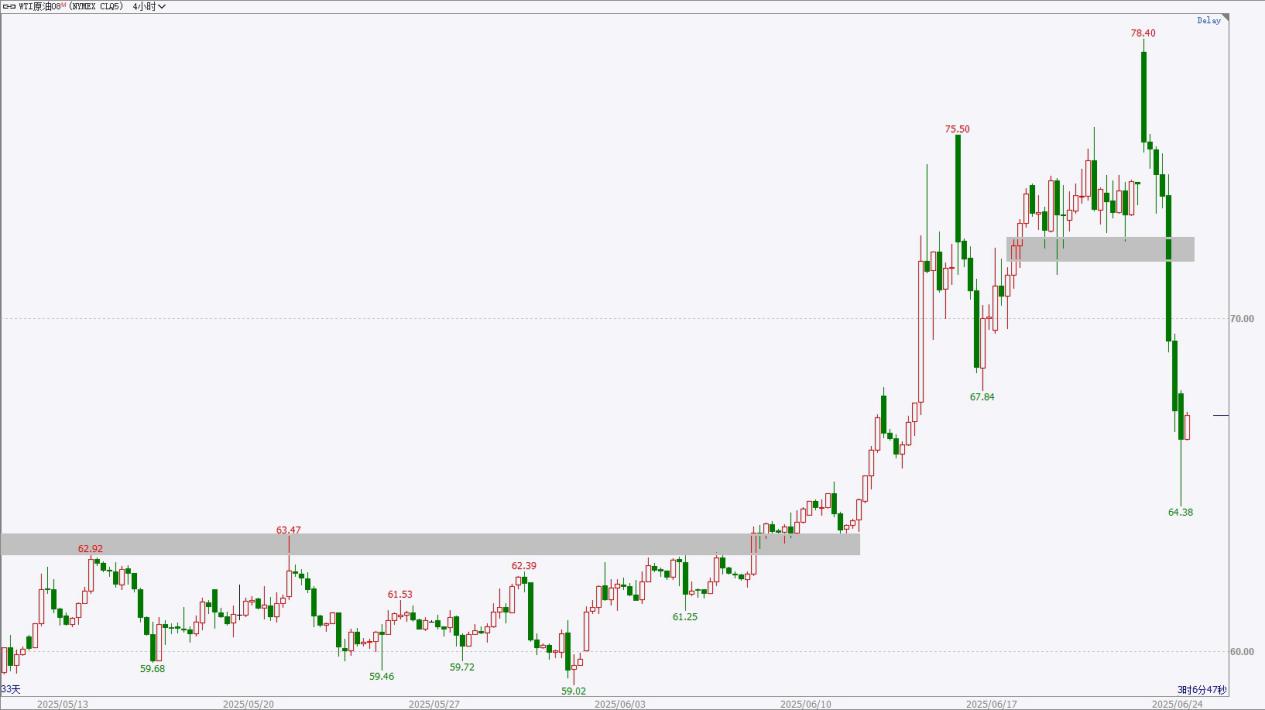
U.S. crude oil opened high and then fell sharply yesterday, with a weak performance in the night session. The current price is testing an important support area, and short-term oscillation is expected while waiting for signs of stabilization, at which point low-buy opportunities may be attempted. Overall, crude oil has been oscillating at low levels previously, then breaking upward at the daily level, showing signs of a stronger market. The upper pressure area is around 79-80, while the lower support area is around 64-65.
Viewpoint: Short-term correction, price testing the neckline support structure, focus on signs of stabilization.
*Pre-market views are time-sensitive and limited, are predictions only, and are for reference and learning purposes only. They do not constitute investment advice, and the risk of operation is borne by the individual. Investment carries risks; trading requires caution.
Fundamental Analysis:
The European Central Bank’s June interest rate decision saw a 25 basis point cut for the seventh consecutive time, nearing the end of the rate-cutting cycle, with discussions on neutral interest rates yet to take place. It lowered inflation expectations for this year and next, as well as GDP growth expectations for next year, with trade escalations leading to slower economic growth and inflation. The Federal Reserve’s June interest rate decision remained unchanged, with a robust labor market, slightly high short-term inflation, and reduced economic uncertainty, while the dot plot indicates two rate cuts within the year. The Eurozone’s manufacturing PMI in May showed slight fluctuations, with a neutral short-term impact.
Technical Analysis:
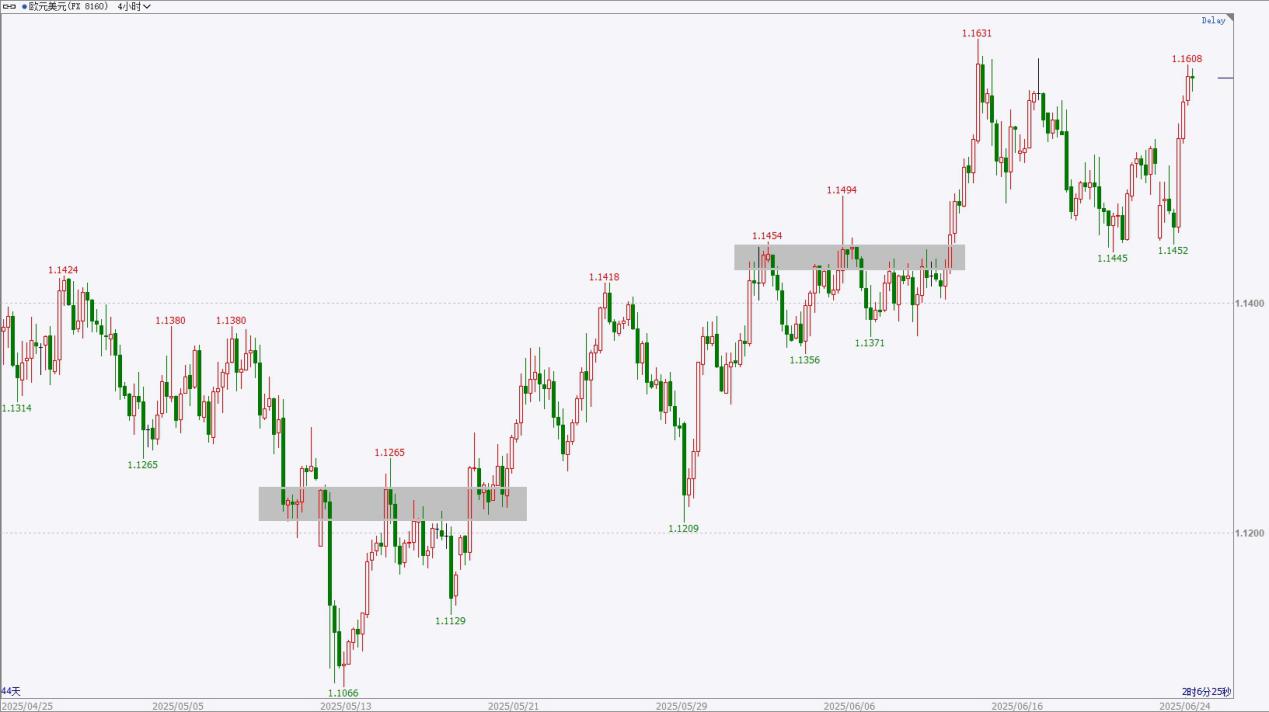
The euro price surged significantly yesterday, closing with a large bullish candle on the daily chart. After multiple tests of the support area, signs of stabilization appeared in the short term, potentially restoring the upward trend. Short-term low-buy opportunities can be attempted on pullbacks, with profit-taking on highs, while attention is on whether the price can reach new highs. Overall, the daily chart shows an upward oscillation, with a strong structure at a larger scale. The upper pressure area is around 1.1600-1.1630, while the lower support area is around 1.1450-1.1480.
Viewpoint: Oscillation is strong, focus on low-buy opportunities on pullbacks, and timely profit-taking.
*Pre-market views are time-sensitive and limited, are predictions only, and are for reference and learning purposes only. They do not constitute investment advice, and the risk of operation is borne by the individual. Investment carries risks; trading requires caution.
Daily Reviews
Our award-winning team of analysts provides keen and insightful technical and fundamental analysis to understand daily market news and investment trading opportunities
HTFX Daily Forex Commentary 0624
Time
Data and Events
Importance
To be determined
Heads of state and government of NATO countries will hold a summit in The Hague from June 24 to 25.
★★★
To be determined
The Summer Davos Forum will be held until June 26.
★★★
16:00
Germany’s June IFO Business Climate Index
★★★
18:00
UK’s June CBI Industrial Orders Balance
★★★
20:30
Canada’s May CPI Monthly Rate
★★★
U.S. First Quarter Current Account
★★★
21:00
U.S. April FHFA House Price Index Monthly Rate
★★★
U.S. April S&P/CS 20-City Composite Home Price Index Yearly Rate
★★★
21:15
2026 FOMC voting member Harker will speak on monetary policy.
★★★
22:00
Federal Reserve Chairman Powell will deliver semiannual monetary policy testimony in the House of Representatives.
★★★★★
Bank of England Governor Bailey will attend the House of Lords Economic Affairs Committee meeting.
★★★
U.S. June Conference Board Consumer Confidence Index
★★★
U.S. June Richmond Fed Manufacturing Index
★★★
22:00
2026 FOMC voting member Harker will participate in a panel discussion at the Barclays-Center for Economic Policy Research (CEPR) Monetary Policy Forum.
★★★
The next day
00:30
FOMC permanent voting member Williams will speak.
★★★
Variety
Viewpoint
Support Range
Resistance Range
U.S. Dollar Index
Weak oscillation
96-97
100-100.5
Gold
Short-term correction
3330-3350
3450-3480
Crude Oil
Short-term correction
64-65
79-80
Euro
Strong oscillation
1.1450-1.1480
1.1600-1.1630
*Pre-market views are time-sensitive and limited, are predictions only, and are for reference and learning purposes only. They do not constitute investment advice, and the risk of operation is borne by the individual. Investment carries risks; trading requires caution.
Fundamental Analysis:
In June, the Federal Reserve maintained interest rates for the fourth consecutive time. The dot plot indicates two rate cuts within the year. Inflation levels are slightly high, uncertainty in the economic outlook has decreased, and the unemployment rate remains low, indicating a stable labor market. In May, non-farm payrolls added 139,000 jobs, which is basically in line with expectations, and the unemployment rate remained unchanged, showing a robust labor market. The unadjusted CPI year-on-year rate in May slightly increased but was below expectations, with a neutral short-term impact.
Technical Analysis:
The U.S. Dollar Index rose and then fell yesterday, closing with an upper shadow and a bearish candle body. The price encountered resistance and retreated, with the short-term trend resuming a weak pattern, possibly testing the support below again. Overall, it shows a large-scale weak oscillation structure, with a large bearish candle on the weekly chart, indicating a short-term rebound trend. The upper resistance area is around 100-100.5, while the lower support area is around 96-97.
Viewpoint: Weak oscillation, focus on support near previous lows, and watch if the price will create new lows again.
*Pre-market views are time-sensitive and limited, are predictions only, and are for reference and learning purposes only. They do not constitute investment advice, and the risk of operation is borne by the individual. Investment carries risks; trading requires caution.
Fundamental Analysis:
The geopolitical situation in the Middle East continues to escalate, with conflicts between Israel and Iran, and instability in Eastern Europe. The European Central Bank’s June interest rate decision saw a 25 basis point cut for the seventh consecutive time, nearing the end of the rate-cutting cycle, while lowering inflation expectations for this year and next, as well as GDP growth expectations for next year. The Federal Reserve’s June interest rate decision remained unchanged, with inflation levels slightly high and a robust labor market, while the dot plot indicates two rate cuts within the year. In May, the U.S. non-farm payrolls saw a slight decline in new jobs, with the unemployment rate remaining unchanged; the unadjusted CPI year-on-year in May showed a slight increase. Attention is on changes in the Middle East situation.
Technical Analysis:
Gold prices saw a slight rise and then a retreat yesterday, with a short-term oscillating structure, currently near a support area. Attention is on signs of stabilization; if it clearly breaks below the support area, the market may weaken further. From a longer-term perspective, the daily chart shows a strong oscillation, encountering resistance near previous highs and retreating. The upper pressure level is around 3450-3480, while the lower support level is around 3330-3350.
Viewpoint: Short-term correction, oscillation in the support area, focus on signs of stabilization.
*Pre-market views are time-sensitive and limited, are predictions only, and are for reference and learning purposes only. They do not constitute investment advice, and the risk of operation is borne by the individual. Investment carries risks; trading requires caution.
Fundamental Analysis:
The June EIA monthly report slightly raised oil price forecasts for this year and next; the OPEC monthly report maintained global oil demand growth expectations for this year and next, as well as economic growth expectations; the IEA monthly report slightly lowered oil demand expectations for this year and next. At the end of May, the OPEC+ ministerial meeting agreed to set 2025 oil production as the benchmark for 2027, with another round of negotiations expected in early June, potentially reaching an agreement to accelerate oil production increases in July. Conflicts in the Middle East may lead to tighter supply expectations. Attention is on changes in the Middle East situation and the EIA crude oil inventory report on Wednesday.
Technical Analysis:
U.S. crude oil opened high and then fell sharply yesterday, with a weak performance in the night session. The current price is testing an important support area, and short-term oscillation is expected while waiting for signs of stabilization, at which point low-buy opportunities may be attempted. Overall, crude oil has been oscillating at low levels previously, then breaking upward at the daily level, showing signs of a stronger market. The upper pressure area is around 79-80, while the lower support area is around 64-65.
Viewpoint: Short-term correction, price testing the neckline support structure, focus on signs of stabilization.
*Pre-market views are time-sensitive and limited, are predictions only, and are for reference and learning purposes only. They do not constitute investment advice, and the risk of operation is borne by the individual. Investment carries risks; trading requires caution.
Fundamental Analysis:
The European Central Bank’s June interest rate decision saw a 25 basis point cut for the seventh consecutive time, nearing the end of the rate-cutting cycle, with discussions on neutral interest rates yet to take place. It lowered inflation expectations for this year and next, as well as GDP growth expectations for next year, with trade escalations leading to slower economic growth and inflation. The Federal Reserve’s June interest rate decision remained unchanged, with a robust labor market, slightly high short-term inflation, and reduced economic uncertainty, while the dot plot indicates two rate cuts within the year. The Eurozone’s manufacturing PMI in May showed slight fluctuations, with a neutral short-term impact.
Technical Analysis:
The euro price surged significantly yesterday, closing with a large bullish candle on the daily chart. After multiple tests of the support area, signs of stabilization appeared in the short term, potentially restoring the upward trend. Short-term low-buy opportunities can be attempted on pullbacks, with profit-taking on highs, while attention is on whether the price can reach new highs. Overall, the daily chart shows an upward oscillation, with a strong structure at a larger scale. The upper pressure area is around 1.1600-1.1630, while the lower support area is around 1.1450-1.1480.
Viewpoint: Oscillation is strong, focus on low-buy opportunities on pullbacks, and timely profit-taking.
*Pre-market views are time-sensitive and limited, are predictions only, and are for reference and learning purposes only. They do not constitute investment advice, and the risk of operation is borne by the individual. Investment carries risks; trading requires caution.
Latest Reviews
HTFX Daily Forex Commentary 0819
HTFX Daily Forex Commentary 0815
HTFX Daily Forex Commentary 0812
HTFX Daily Forex Commentary 0811
Choose a Trusted Broker for Trading
Over 300 employees worldwide, more than 1,000 products, top-tier liquidity